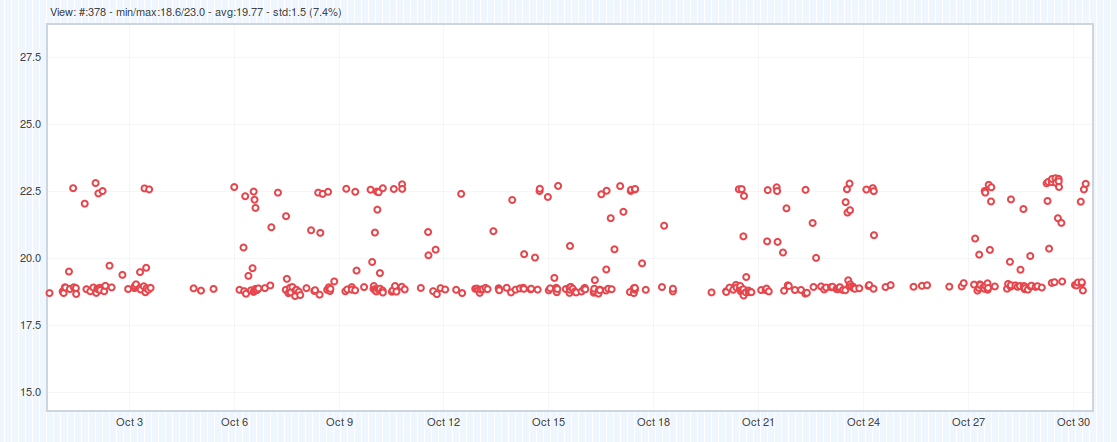
Often I hear about our talos results, why are they so noisy? What is noise in this context- by noise we are referring to a larger stddev in the results we track, here would be an example:
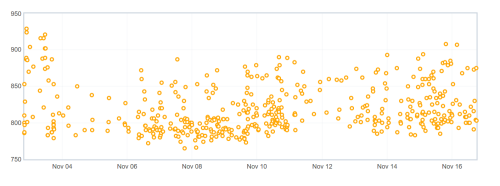
With the large spread of values posted regularly for this series, it is hard to track improvements or regressions unless they are larger or very obvious.
Knowing the definition of noise, there are a few questions that we often need to answer:
- Developers working on new tests- what is the level of noise, how to reduce it, what is acceptable
- Over time noise changes- this causes false alerts, often not related to to code changes or easily discovered via infra changes
- New hardware we are considering- is this hardware going to post reliable data for us.
What I care about is the last point, we are working on replacing the hardware we run performance tests on from old 7 year old machines to new machines! Typically when running tests on a new configuration, we want to make sure it is reliably producing results. For our system, we look for all green:
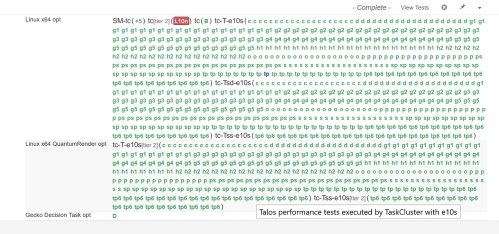
This is really promising- if we could have all our tests this “green”, developers would be happy. The catch here is these are performance tests, are the results we collect and post to graphs useful? Another way to ask this is are the results noisy?
To answer this is hard, first we have to know how noisy things are prior to the test. As mentioned 2 weeks ago, Talos collects 624 metrics that we track for every push. That would be a lot of graph and calculating. One method to do this is push to try with a single build and collect many data points for each test. You can see that in the image showing the all green results.
One method to see the noise, is to look at compare view. This is the view that we use when comparing one push to another push when we have multiple data points. This typically highlights the changes that are easy to detect with our t-test for alert generation. If we look at the above referenced push and compare it to itself, we have:
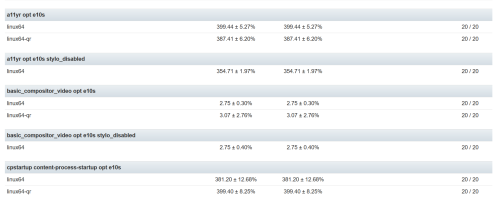
Here you can see for a11y, linux64 has +- 5.27 stddev. You can see some metrics are higher and others are lower. What if we add up all the stddev numbers that exist, what would we have? In fact if we treat this as a sum of the squares to calculate the variance, we can generate a number, in this case 64.48! That is the noise for that specific run.
Now if we are bringing up a new hardware platform, we can collect a series of data points on the old hardware and repeat this on the new hardware, now we can compare data between the two:
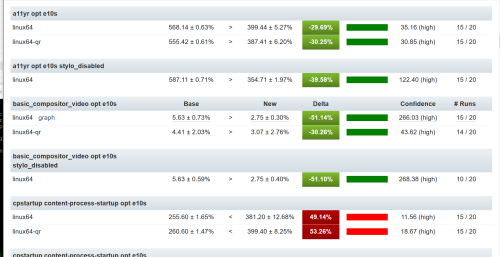
What is interesting here is we can see side by side the differences in noise as well as the improvements and regressions. What about the variance? I wanted to track that and did, but realized I needed to track the variance by platform, as each platform could be different- In bug 1416347, I set out to add a Noise Metric to the compare view. This is on treeherder staging, probably next week in production. Here is what you will see:
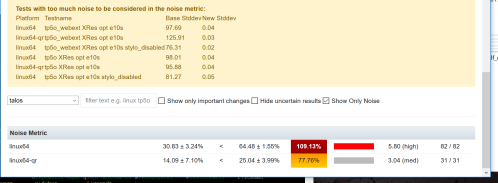
Here we see that the old hardware has a noise of 30.83 and the new hardware a noise of 64.48. While there are a lot of small details to iron out, while we work on getting new hardware for linux64, windows7, and windows10, we now have a simpler method for measuring the stability of our data.