Tag Archives: tools

Measuring the noise in Performance tests

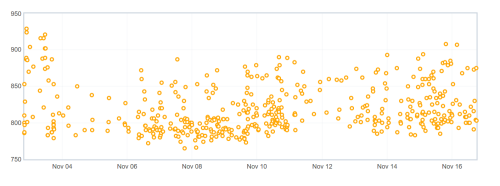
Often I hear about our talos results, why are they so noisy?  What is noise in this context- by noise we are referring to a larger stddev in the results we track, here would be an example:
noise_example

With the large spread of values posted regularly for this series, it is hard to track improvements or regressions unless they are larger or very obvious.

Knowing the definition of noise, there are a few questions that we often need to answer:

  • Developers working on new tests- what is the level of noise, how to reduce it, what is acceptable
  • Over time noise changes- this causes false alerts, often not related to to code changes or easily discovered via infra changes
  • New hardware we are considering- is this hardware going to post reliable data for us.

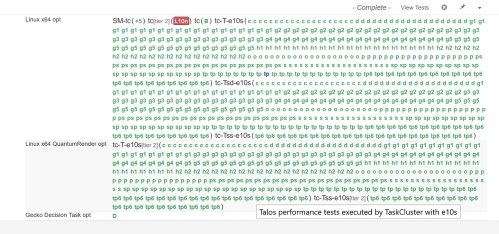
What I care about is the last point, we are working on replacing the hardware we run performance tests on from old 7 year old machines to new machines!  Typically when running tests on a new configuration, we want to make sure it is reliably producing results.  For our system, we look for all green:
all_green

This is really promising- if we could have all our tests this “green”, developers would be happy.  The catch here is these are performance tests, are the results we collect and post to graphs useful?  Another way to ask this is are the results noisy?

To answer this is hard, first we have to know how noisy things are prior to the test.  As mentioned 2 weeks ago, Talos collects 624 metrics that we track for every push.  That would be a lot of graph and calculating.  One method to do this is push to try with a single build and collect many data points for each test.  You can see that in the image showing the all green results.

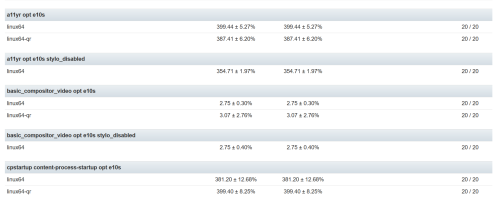
One method to see the noise, is to look at compare view.  This is the view that we use when comparing one push to another push when we have multiple data points.  This typically highlights the changes that are easy to detect with our t-test for alert generation.  If we look at the above referenced push and compare it to itself, we have:
self_compare


Here you can see for a11y, linux64 has +- 5.27 stddev.  You can see some metrics are higher and others are lower.  What if we add up all the stddev numbers that exist, what would we have?  In fact if we treat this as a sum of the squares to calculate the variance, we can generate a number, in this case 64.48!  That is the noise for that specific run.

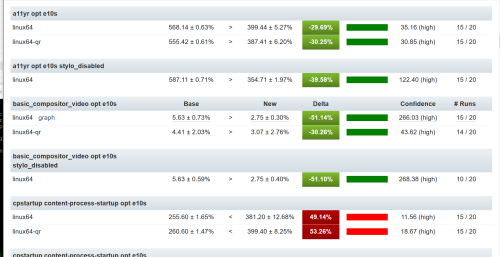
Now if we are bringing up a new hardware platform, we can collect a series of data points on the old hardware and repeat this on the new hardware, now we can compare data between the two:
hardware_compare

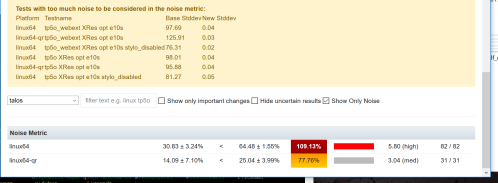
What is interesting here is we can see side by side the differences in noise as well as the improvements and regressions.  What about the variance?  I wanted to track that and did, but realized I needed to track the variance by platform, as each platform could be different- In bug 1416347, I set out to add a Noise Metric to the compare view.  This is on treeherder staging, probably next week in production.  Here is what you will see:
noise_view

Here we see that the old hardware has a noise of 30.83 and the new hardware a noise of 64.48.  While there are a lot of small details to iron out, while we work on getting new hardware for linux64, windows7, and windows10, we now have a simpler method for measuring the stability of our data.



2 Comments

Filed under testdev

Are there any trends in our Talos regression bugs?

Now that we have a better process for taking action on Talos alerts and pushing them to resolution, it is time to take a step back and see if any trends show up in our bugs.

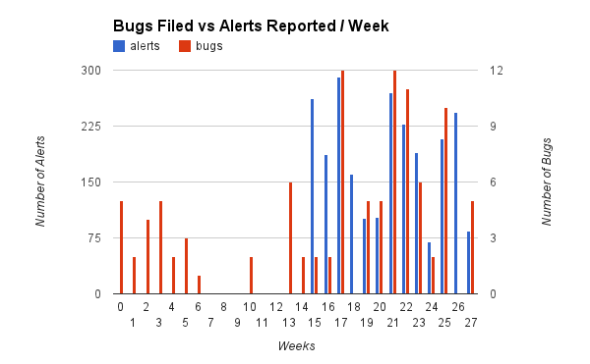
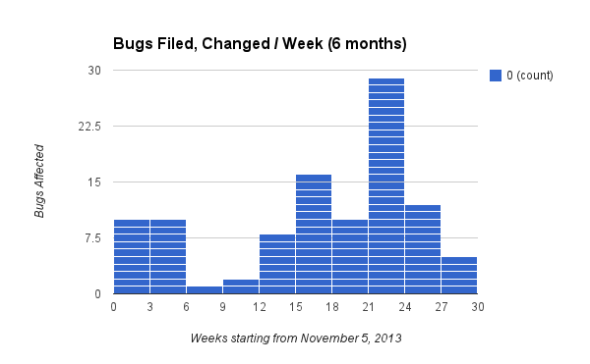
First I want to look at bugs filed/week:

Image

This is fun to see, now what if we stack this up side by side with the alerts we receive:

Image

We started tracking alerts halfway through this process.  We show that for about 1 out of every 25 alerts we file a bug.  I had previously stated it was closer to 1/33 alerts (it appears that is averaging out the first few weeks).

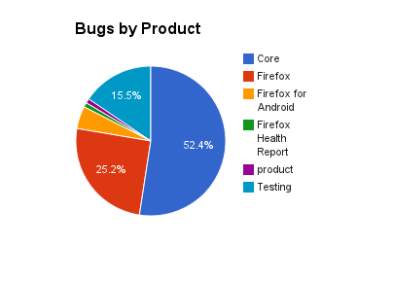
Lets see where these bugs are filed, here is a view of the different bugzilla products:

Image

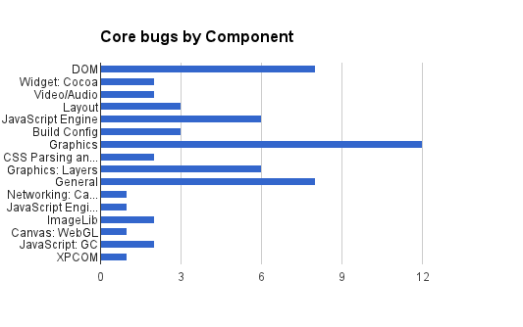
The Testing product is used to file bugs that we cannot figure out the exact changeset, so they get filed in testing::talos.  As there are almost 30 unique components bugs are filed in, I took a few minutes to look at the Core product, here is where the bugs live in Core:

Image

Pardon my bad graphing attempt here with the components cut off.  Graphics is the clear winner for regressions (with “graphics: layers” being a large part of it).  Of course the Javascript Engine and DOM would be there (a lot of our tests are sensitive to changes here).  This really shows where our test coverage is more than where bad code lives. 

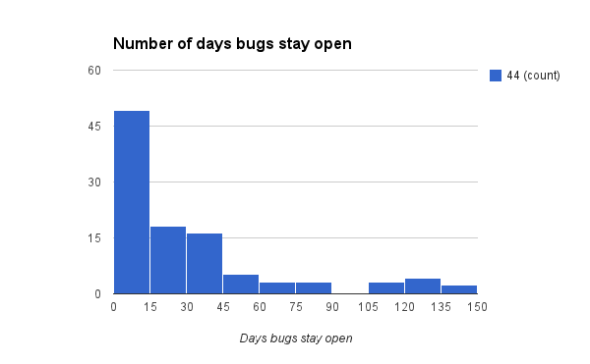
Now that I know where the bugs are, here is a view of how long the bugs stay open:

Image

The fantastic news is most of our bugs are resolved in <=15 days!  I think this is a metric we can track and get better at- ideally closing all Talos regression bugs in <30 days.

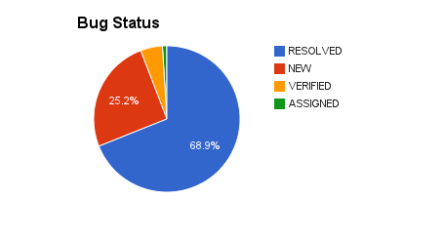
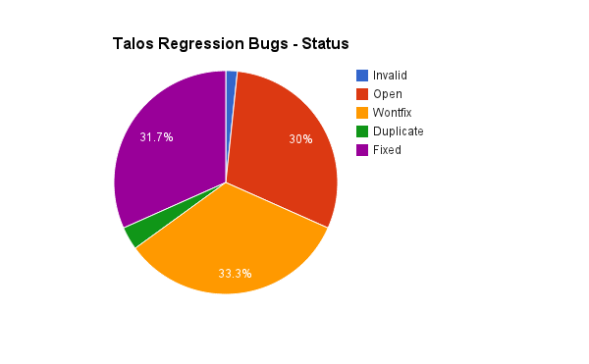
Looking over all the bugs we have, what is the status of them?

Image

Yay for the blue pacman!  We have a lot of new bugs instead of assigned bugs, that might be something we could adjust and assign owners once it is confirmed and briefly discussed- that is still up in the air.

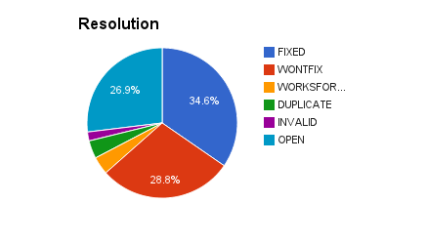
The burning question is what are all the bugs resolved as?

Image

To me this seems healthy, it is a starting point.  Tracking this over time will probably be a useful metric!


In summary, many developers have done great work to make improvements and fix patches over the last 6 months that we have been tracking this information.  There are things we can do better, I want to know-

What information provided today is useful to track regularly?

Is there something you would rather see?


3 Comments

Filed under Uncategorized

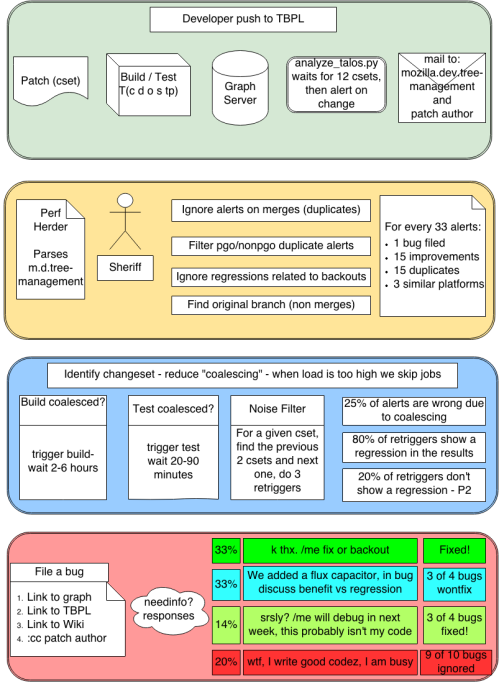
The lifecycle of a Talos performance regression

The lifecycle of a Talos performance regression

The cycle of landing a change to Firefox that affects performance

Leave a comment

May 8, 2014 · 9:38 am

Performance Alerts – by the numbers

If you have ever received an automated mail about a performance regression, and then 10 more, you probably are frustrated by the volume of alerts.  6 months ago, I started looking at the alerts and filing bugs, and 10 weeks ago a little tool was written to help out.

What have I seen in 10 weeks:

1926 alerts on mozilla.dev.tree-management for Talos resulting in 58 bugs filed (or 1 bug/33 alerts):

Image

*keep in mind that many alerts are improvements, as well as duplicated between trees and pgo/nonpgo


Now for some numbers as we uplift.  How are we doing from one release to another?  Are we regressing, Improving?  These are all questions I would like to answer in the coming weeks.

Firefox 30 uplift, m-c -> Aurora:

  • 26 – regressions (4 TART, 4 SVG, 3 TS, Paint, and many more)
    • 2 remaining bugs not resolved as we are now on Beta (bug 990183, bug 990194)


Firefox 31 uplift, m-c -> Aurora (tracking bug 990085):


Is this useful information?

Are there questions you would rather I answer with this data?


3 Comments

Filed under Uncategorized

polishing browser-chrome – coming to a branch near you soon

The last 2 weeks I have gone head first into a world of resolving some issues with our mochitest browser-chrome tests with RyanVM, Armen, and the help of Gavin and many developers who are fixing problems left and right.

There are 3 projects I have been focusing on:

1) Moving our Linux debug browser chrome tests off our old fedora slaves in a datacenter and running them on ec2 slave instances, in bug 987892.

These are live and green on all Firefox 29, 30, and 31 trees!  More work is needed for Firefox-28 and ESR-24 which should be wrapped up this week.  Next week we can stop running all linux unittests on fedora slaves.

2) Splitting all the developer tools tests out of the browser-chrome suite into their own suite in bug 984930.

browser-chrome tests have been a thorn in the side of the sheriff team for many months.  More and more the rapidly growing features and tests of developer tools have been causing the entire browser-chrome suite to fail, in cases of debug to run for hours.  Splitting this out gives us a small shield of isolation.  In fact, we have this running well on Cedar, we are pushing hard to have this rolled out to our production and development branches by the end of this week!

3) Splitting the remaining browser chrome tests into 3 chunks, in bug 819963.

Just like the developer tools, we have been running browser-chrome in 3 chunks on Cedar.  With just 7 tests disabled, we are very green and consistently green. 


While there are a lot of other changes going on under the hood, what will be seen by next week on your favorite branch of Firefox will be:

  • ‘dt’ jobs for opt, and ‘dt1’, ‘dt2’, ‘dt3’ jobs for debug
  • ‘bc’ job will turn into ‘bc1’, ‘bc2’, ‘bc3’
  • much faster turnaround times on bc tests (62 minutes is the slowest right now, the rest are averaging ~20 minutes/job)
  • less random orange cluttering up results


Leave a comment

Filed under Uncategorized

Performance Bugs – How to stay on top of Talos regressions

Talos is the framework used for desktop Firefox to measure performance for every patch that gets checked in.  Running tests for every checkin on every platform is great, but who looks at the results?

As I mentioned in a previous blog post, I have been looking at the alerts which are posted to dev.tree-management, and taking action on them if necessary.  I will save discussing my alert manager tool for another day.  One great thing about our alert system is that we send an email to the original patch author if we can determine who it is.  What is great is many developers already take note of this and take actions on their own.  I see many patches backed out or discussed with no one but the developer initiating the action.

So why do we need a Talos alert sheriff?  For the main reason that not even half of the regressions are acted upon.  There are valid reasons for this (wrong patch identified, noisy data, doesn’t seem related to the patch) and of course many regressions are ignored due to lack of time.  When I started filing bugs 6 months ago, I incorrectly assumed all of them would be fixed or resolved as wontfix for a valid reason.  This happens for most of the bugs, but many regressions get forgotten about.

When we did the uplift of Firefox 30 from mozilla-central to mozilla-aurora, we saw 26 regression alerts come in and 4 improvement alerts.  This prompted us to revisit the process of what we were doing and what could be done better.  Here are some of the new things we will be doing:

  • For all regressions found, attempt to find the original bug and reopen/comment in the bug
  • For some regressions that it is not easy to find the original bug, we will open a new bug
  • All bugs that have regression information will be marked as blocking a new tracking bug
  • For each release we will create a new tracking bug for all regressions
  • After an uplift from central->aurora, we will ensure we have all alerts mapped to existing regressions

As this process goes through a cycle or two, we will refine it to ensure we have less noise for developers and more accuracy in tracking regressions faster


Leave a comment

Filed under Uncategorized

notes on a python webserver

Last week I created a python webserver as a patch for make talos-remote.  This ended up being frought with performance issues, so I have started looking into it.  I based it off of the profileserver.py that we have in mozilla-central, and while it worked I was finding my tp4 tests were timing out.

I come to find out we are using a synchronous webserver, so this is easy to fix with a ThreadingMixIn, just like the chromium perf.py script:

class MyThreadedWebServer(ThreadingMixIn, BaseHTTPServer.HTTPServer):
    pass

Now the test was finishing, but very very slowly (20+ minutes vs ❤ minutes).  After doing a CTRL+C on the webserver, I saw a lot of requests hanging on log_message and gethostbyaddr() calls.  So I ended up overloading the log_message call and things worked.

class MozRequestHandler(SimpleHTTPServer.SimpleHTTPRequestHandler):
    # I found on my local network that calls to this were timing out
    def address_string(self):
        return "a.b.c.d"

    # This produces a LOT of noise
    def log_message(self, format, *args):
        pass

Now tp4m runs as fast as using apache on my host machine.

4 Comments

Filed under testdev

converting xpcshell from listing directories to a manifest

Last year we ventured down the path of adding test manifests for xpcshell in bug 616999.  Finding a manifest format is not easy because there are plenty of objections to the format, syntax and relevance to the project at hand.  At the end of the day, we depend too much on our build system to filter tests and after that we have hardcoded data in tests or harnesses to run or ignore based on certain criteria.  So for xpcshell unittests, we have added a manifest so we can start to keep track of all these tests and not depend on iterating directories and sorting or reverse sorting head and tail files.

The first step is to get a manifest format for all existing tests.  This was landed today in bug 616999 and is currently on mozilla-central.  This requires that all test files in directories be in the manifest file and that the manifest file includes all files in the directory (verified at make time).  Basically if you do a build, it will error out if you forget to add a manifest or test file to the manifest.  Pretty straightforward.

The manifest we have chosen is the ini format from mozmill.  We found that there is no silver bullet for a perfect test manifest, which is why we chose an existing format that met the needs of xpcshell.  This is easy to hand edit (as opposed to json), is easy to parse from python and javascript.  As compared to reftests which have a custom manifest format, we needed to just have a list of test files and more specifically a way to associate a head and tail script file (not easy with reftest manifests).  The format might not work for everything, but it gives us a second format to work with depending on the problem we are solving.

Leave a comment

Filed under testdev

Some notes about adding new tests to talos

Over the last year and a half I have been editing the talos harness for various bug fixes, but just recently I have needed to dive in and add new tests and pagesets to talos for Firefox and Fennec.  Here are some of the things I didn’t realize or have inconveniently forget about what goes on behind the scenes.

  • tp4 is really 4 tests: tp4, tp4_nochrome, tp4_shutdown, tp4_shutdown_nochrome.  This is because in the .config file, we have “shutdown: true” which adds _shutdown to the test name and running with –noChrome adds the _nochrome to the test name.  Same with any test that us run with the shutdown=true and nochrome options.
  • when adding new tests, we need to add the test information to the graph server (staging and production).  This is done in the hg.mozilla.org/graphs repository by adding to data.sql.
  • when adding new pagesets (as I did for tp4 mobile), we need to provide a .zip of the pages and the pageloader manifest to release engineering as well as modifying the .config file in talos to point to the new manifest file.  see bug 648307
  • Also when adding new pages, we need to add sql for each page we load.  This is also in the graphs repository bug in pages_table.sql.
  • When editing the graph server, you need to file a bug with IT to update the live servers and attach a sql file (not a diff).   Some examples: bug 649774 and bug 650879
  • after you have the graph servers updated, staging run green, review done, then you can check in the patch for talos
  • For new tests, you also have to create a buildbot config patch to add the testname to the list of tests that are run for talos
  • the last step is to file a release engineering bug to update talos on the production servers.  This is done by creating a .zip of talos, posting it on a ftp site somewhere and providing a link to it in the bug.
  • one last thing is to make sure the bug to update talos has an owner and is looked at, otherwise it can sit for weeks with no action!!!

This is my experience from getting ts_paint, tpaint, and tp4m (mobile only) tests added to Talos over the last couple months.

Leave a comment

Filed under testdev

Orange Factor and the WOO-Tang Clan

I have silently put up a tool call Orange Factor early last month as part of the War On Orange (WOO) project.  Over the last few weeks I have been iterating on this and working with jgriffin, jhammel, mcote and ctalbert (some have referred to us as the WOO-tang clan) to make this more useful and accurate.  Let me outline a few features of the site to give you a general introduction.

To start off with I know it takes a long time to load, but it should load in <30 seconds.   All the data is collected from bugs that are blocking randomorange.  This is done by parsing the comments and linked tinderbox logs to determine the frequency and type of failure.  We display a graph that tracks the cumulative orange factor (failure/push) over time.  NOTE: we are going off the number of pushes, not the number of tests ran.


Orange Factor graph

Graph of the Orange Factor over time

Next there is  the Heatmap.  This is similar to what you see on tinderboxpushlog, except this is color code by the number of failures.

Overall HeatMap

Overall HeatMap

From the HeatMap, you can click on a specific value to see more details about that test run (in the time range).  For example, here is OSX MoOth:

OSX MOth Testrun

OSX MOth Testrun

Ok, this is really cool.  You can click on each day and filter down to the specific day, also at the top, you see the drop down select boxes.  This is super awesome because you can slice and dice up the data to view it just how you want.

Next I want to show you what the view looks like for a specific day.  On the left hand side of the webpage is a Calendar, you can click any day (I clicked Sept 11th) or click the day on a test run or orange factor graph (hover your mouse over the graph and a link will show up).

Daily Test Results for all tests by Platform

Daily Test Results for all tests by Platform

You should get the point that there are many ways to view the data.  Actually probably too much information!  So lately we have been working on some bug centric views.  To start off with, we have a topfails style report but this is based on bugs, not failures in log files.  To get here, click on the “Research and Top Bugs” link on the right hand side of the page.  Here is a  “weekly” view that is the top 5 bugs per week:

Top 5 Bugs every 7 days

Top 5 Bugs every 7 days

Hover over the color bars to see the bug number and research it in more details.  Here is what you see when viewing a specific bug (544601):

Individual Bug Graph over Time

Individual Bug Graph over Time

Orange Factor has much more to offer, just poke around and see how you can make it useful.  Feedback is welcome, and feel free to ask any questions in #ateam!

2 Comments

Filed under testdev