Digging into regressions

Whenever a patch is landed on autoland, it will run many builds and tests to make sure there are no regressions.  Unfortunately many times we find a regression and 99% of the time backout the changes so they can be fixed.  This work is done by the Sheriff team at Mozilla- they monitor the trees and when something is wrong, they work to fix it (sometimes by a quick fix, usually by a backout).  A quick fact, there were 1228 regressions in H1 (January-June) 2019.

My goal in writing is not to recommend change, but instead to start conversations and figure out what data we should be collecting in order to have data driven discussions.  Only then would I expect that recommendations for changes would come forth.

What got me started in looking at regressions was trying to answer a question: “How many regressions did X catch?”  This alone is a tough question, instead I think the question should be “If we were not running X, how many regressions would our end users see?”  This is a much different question and has two distinct parts:

  • Unique Regressions: Only look at regressions found that only X found, not found on both X and Y
  • Product Fixes: did the regression result in changing code that we ship to users? (i.e. not editing the test)
  • Final Fix: many times a patch [set] lands and is backed out multiple times, in this case do we look at each time it was backed out, or only the change from initial landing to final landing?

These can be more difficult to answer.  For example, Product Fixes- maybe by editing the test case we are preventing a regression in the future because the test is more accurate.

In addition we need to understand how accurate the data we are using is.  As the sheriffs do a great job, they are human and humans make judgement calls.  In this case once a job is marked as “fixed_by_commit”, then we cannot go back in and edit it, so a typo or bad data will result in incorrect data.  To add to it, often times multiple patches are backed out at the same time, so is it correct to say that changes from bug A and bug B should be considered?

This year I have looked at this data many times to answer:

This data is important to harvest because if we were to turn off a set of jobs or run them as tier-2 we would end up missing regressions.  But if all we miss is editing manifests to disable failing tests, then we are getting no value from the test jobs- so it is important to look at what the regression outcome was.

In fact every time I did this I would run an active-data-recipe (fbc recipe in my repo) and have a large pile of data I needed to sort through and manually check.  I spent some time every day for a few weeks looking at regressions and now I have looked at 700 (bugs/changesets).  I found that in manually checking regressions, the end results fell into buckets:

test 196 28.00%
product 272 38.86%
manifest 134 19.14%
unknown 48 6.86%
backout 27 3.86%
infra 23 3.29%

Keep in mind that many of the changes which end up in mozilla-central are not only product bugs, but infrastructure bugs, test editing, etc.

After looking at many of these bugs, I found that ~80% of the time things are straightforward (single patch [set] landed, backed out once, relanded with clear comments).  Data I would like to have easily available via a query:

  • Files that are changed between backout and relanding (even if it is a new patch).
  • A reason as part of phabricator that when we reland, it is required to have a few pre canned fields

Ideally this set of data would exist for not only backouts, but for anything that is landed to fix a regression (linting, build, manifest, typo).

Leave a comment

Filed under data, testdev

Recent fixes to reduce backlog on Android phones

Last week it seemed that all our limited resource machines were perpetually backlogged. I wrote yesterday to provide insight into what we run and some of our limitations. This post will be discussing the Android phones backlog last week specifically.

The Android phones are hosted at Bitbar and we split them into pools (battery testing, unit testing, perf testing) with perf testing being the majority of the devices.

There were 6 fixes made which resulted in significant wins:

  1. Recovered offline devices at Bitbar
  2. Restarting host machines to fix intermittent connection issues at Bitbar
  3. Update Taskcluster generic-worker startup script to consume superceded jobs
  4. Rewrite the scheduling script as multi-threaded and utilize bitbar APIs more efficiently
  5. Turned off duplicate jobs that were on by accident last month
  6. Removed old taskcluster-worker devices

On top of this there are 3 future wins that could be done to help future proof this:

  1. upgrade android phones from 8.0 -> 9.0 for more stability
  2. Enable power testing on generic usb hubs rather than special hubs which require dedicated devices.
  3. merge all separate pools together to maximize device utilization

With the fixes in place, we are able to keep up with normal load and expect that future spikes in jobs will be shorter lived, instead of lasting an entire week.

Recovered offline devices at Bitbar
Every day a 2-5 devices are offline for some period of time. The Bitbar team finds some on their own and resets the devices, sometimes we notice them and ask for the devices
to be reset. In many cases the devices are hung or have trouble on a reboot (motivation for upgrading to 9.0). I will add to this that the week prior things started getting sideways and it was a holiday week for many, so less people were watching things and more devices ended up in various states.

In total we have 40 pixel2 devices in the perf pool (and 37 Motorola G5 devices as well) and 60 pixel2 devices when including the unittest and battery pools. We found that 19 devices were not accepting jobs and needed attention Monday July 8th. For planning purposes it is assumed that 10% of the devices will be offline, in this case we had 1/3 of our devices offline and we were doing merge day with a lot of big pushes running all the jobs.

Restarting host machines to fix intermittent connection issues at Bitbar
At Bitbar we have a host machine with 4 or more docker containers running and each docker container runs Linux with the Taskcluster generic-worker and the tools to run test jobs. Each docker container is also mapped directly to a phone. The host machines are rarely rebooted and maintained, and we noticed a few instances where the docker containers had trouble connecting to the network.  A fix for this was to update the kernel and schedule periodic reboots.

Update Taskcluter generic-worker startup script
When the job is superseded, we would shut down the Taskcluster generic-worker, the docker image, and clean up. Previously it would terminate the job and docker container and then wait for another job to show up (often a 5-20 minute cycle). With the changes made Taskcluster generic-worker will just restart (not docker container) and quickly pick up the next job.

Rewrite the scheduling script as multi-threaded
This was a big area of improvement that was made. As our jobs increased in volume and had a wider range of runtimes, our tool for scheduling was iterating through the queue and devices and calling the APIs at Bitbar to spin up a worker and hand off a task. This is something that takes a few seconds per job or device and with 100 devices it could take 10+ minutes to come around and schedule a new job on a device. With changes made last week ( Bug 1563377 ) we now have jobs starting quickly <10 seconds, which greatly increases our device utilization.

Turn off duplicate opt jobs and only run PGO jobs
In reviewing what was run by default per push and on try, a big oversight was discovered. When we turned PGO on for Android, all the perf jobs were scheduled both for opt and PGO, when they should have been only scheduled for PGO. This was an easy fix and cut a large portion of the load down (Bug 1565644)

Removed old taskcluster-worker devices
Earlier this year we switched to Taskcluster generic-worker and in the transition had to split devices between the old taskcluster-worker and the new generic-worker (think of downstream branches).  Now everything is run on generic-worker, but we had 4 devices still configured with taskcluster-worker sitting idle.
Given all of these changes, we will still have backlogs that on a bad day could take 12+ hours to schedule try tasks, but we feel confident with the current load we have that most of the time jobs will be started in a reasonable time window and worse case we will catch up every day.

A caveat to the last statement, we are enabling webrender reftests on android and this will increase the load by a couple devices/day. Any additional tests that we schedule or large series of try pushes will cause us to hit the tipping point. I suspect buying more devices will resolve many complaints about lag and backlogs. Waiting for 2 more weeks would be my recommendation to see if these changes made have a measurable change on our backlog. While we wait it would be good to have agreement on what is an acceptable backlog and when we cross that threshold regularly that we can quickly determine the number of devices needed to fix our problem.

2 Comments

Filed under Uncategorized

backlogs, lag, and waiting

Many times each week I see a ping on IRC or Slack asking “why are my jobs not starting on my try push?”  I want to talk about why we have backlogs and some things to consider in regards to fixing the problem.

It a frustrating experience when you have code that you are working on or ready to land and some test jobs have been waiting for hours to run. I personally experienced this the last 2 weeks while trying to uplift some test only changes to esr68 and I would get results the next day. In fact many of us on our team joke that we work weekends and less during the week in order to get try results in a reasonable time.

It would be a good time to cover briefly what we run and where we run it, to understand some of the variables.

In general we run on 4 primary platforms:

  • Linux: Ubuntu 16.04
  • OSX: 10.14.5
  • Windows: 7 (32 bit) + 10 (v1803) + 10 (aarch64)
  • Android: Emulator v7.0, hardware 7.0/8.0

In addition to the platforms, we often run tests in a variety of configs:

  • PGO / Opt / Debug
  • Asan / ccov (code coverage)
  • Runtime prefs: qr (webrender) / spi (socket process) / fission (upcoming)

In some cases a single test can run >90 times for a given change when iterated through all the different platforms and configurations. Every week we are adding many new tests to the system and it seems that every month we are changing configurations somehow.

In total for January 1st to June 30th (first half of this year) Mozilla ran >25M test jobs. In order to do that, we need a lot of machines, here is what we have:

  • linux
    • unittests are in AWS – basically unlimited
    • perf tests in data center with 200 machines – 1M jobs this year
  • Windows
    • unittests are in AWS – some require instances with a dedicated GPU and that is a limited pool)
    • perf tests in data center with 600 machines – 1.5M jobs this year
    • Windows 10 aarch64 – 35 laptops (at Bitbar) that run all unittests and perftests, a new platform in 2019 and 20K jobs this year
    • Windows 10 perf reference (low end) laptop – 16 laptops (at Bitbar) that run select perf tests, 30K jobs this year
  • OSX
    • unittests and perf tests run in data center with 450 mac minis – 380K jobs this year
  • Android
    • Emulators (packet.net fixed pool of 50 hosts w/4 instances/host) 493K jobs this year – run most unittests on here
      • will have much larger pool in the near future
    • real devices – we have 100 real devices (at Bitbar) – 40 Motorola – G5’s, 60 Google Pixel2’s running all perf tests and some unittests- 288K jobs this year

You will notice that OSX, some windows laptops, and android phones are a limited resource and we need to be careful for what we run on them and ensure our machines and devices are running at full capacity.

These limited resource machines are where we see jobs scheduled and not starting for a long time. We call this backlog, it could also be referred to as lag. While it would be great to point to a public graph showing our backlog, we don’t have great resources that are uniform between all machine types. Here is a view of what we have internally for the Android devices:bitbar_queue

What typically happens when a developer pushes their code to a try server to run all the tests, many jobs finish in a reasonable amount of time, but jobs scheduled on resource constrained hardware (such as android phones) typically have a larger lag which then results in frustration.

How do we manage the load:

  1. reduce the number of jobs
  2. ensure tooling and infrastructure is efficient and fully operational

I would like to talk about how to reduce the number of jobs. This is really important when dealing with limited resources, but we shouldn’t ignore this on all platforms. The things to tweak are:

  1. what tests are run and on what branches
  2. what frequency we run the tests at
  3. what gets scheduled on try server pushes

I find that for 1, we want to run everything everywhere if possible, this isn’t possible, so one of our tricks is to run things on mozilla-central (the branch we ship nightlies off of) and not on our integration branches. A side effect here is a regression isn’t seen for a longer period of time and finding a root cause can be more difficult. One recent fix was  when PGO was enabled for android we were running both regular tests and PGO tests at the same time for all revisions- we only ship PGO and only need to test PGO, the jobs were cut in half with a simple fix.

Looking at 2, the frequency is something else. Many tests are for information or comparison only, not for tracking per commit.  Running most tests once/day or even once/week will give a signal while our most diverse and effective tests are running more frequently.

The last option 3 is where all developers have a chance to spoil the fun for everyone else. One thing is different for try pushes, they are scheduled on the same test machines as our release and integration branches, except they are put in a separate queue to run which is priority 2. Basically if any new jobs get scheduled on an integration branch, the next available devices will pick those up and your try push will have to wait until all integration jobs for that device are finished. This keeps our trees open more frequently (if we have 50 commits with no tests run, we could be backing out changes from 12 hours ago which maybe was released or maybe has bitrot while performing the backout). One other aspect of this is we have >10K jobs one could possibly run while scheduling a try push and knowing what to run is hard. Many developers know what to run and some over schedule, either out of difficulty in job selection or being overly cautious.

Keeping all of this in mind, I often see many pushes to our try server scheduling what looks to be way too many jobs on hardware. Once someone does this, everybody else who wants to get their 3 jobs run have to wait in line behind the queue of jobs (many times 1000+) which often only get ran during night for North America.

I would encourage developers pushing to try to really question if they need all jobs, or just a sample of the possible jobs.  With tools like |/.mach try fuzzy| , |./mach try chooser| , or |./mach try empty| it is easier to schedule what you need instead of blanket commands that run everything.  I also encourage everyone to cancel old try pushes if a second try push has been performed to fix errors from the first try push- that alone saves a lot of unnecessary jobs from running.


1 Comment

Filed under Uncategorized

Looking at Firefox performance 57 vs 63

Last November we released Firefox v.57, otherwise known as Firefox Quantum.  Quantum was in many ways a whole new browser with the focus on speed as compared to previous versions of Firefox.

As I write about many topics on my blog which are typically related to my current work at Mozilla, I haven’t written about measuring or monitoring Performance in a while.  Now that we are almost a year out I thought it would be nice to look at a few of the key performance tests that were important for tracking in the Quantum release and what they look like today.

First I will look at the benchmark Speedometer which was used to track browser performance primarily of the JS engine and DOM.  For this test, we measure the final score produced, so the higher the number the better:

speedometer

You can see a large jump in April, that is when we upgraded the hardware we run the tests on, otherwise we have only improved since last year!

Next I want to look at our startup time test (ts_paint) which measure time to launch the browser from a command line in ms, in this case lower is better:

ts_paint

Here again,  you can see the hardware upgrade in April, overall we have made this slightly better over the last year!

What is more interesting is a page load test.  This is always an interesting test and there are many opinions about the right way to do this.  How we do pageload is to record a page and replay it with mitmproxy.  Lucky for us (thanks to neglect) we have not upgraded our pageset so we can really compare the same page load from last year to today.

For our pages we initially setup, we have 4 pages we recorded and have continued to test, all of these are measured in ms so lower is better.

Amazon.com (measuring time to first non blank paint):

amazon

We see our hardware upgrade in April, otherwise small improvements over the last year!

Facebook (logged in with a test user account, measuring time to first non blank paint):

facebook

Again, we have the hardware upgrade in April, and overall we have seen a few other improvements 🙂

Google (custom hero element on search results):

google

Here you can see that what we had a year ago, we were better, but a few ups and downs, overall we are not seeing gains, nor wins (and yes, the hardware upgrade is seen in April).

Youtube (measuring first non blank paint):

youtube

As you can see here, there wasn’t a big change in April with the hardware upgrade, but in the last 2 months we see some noticeable improvements!

In summary, none of our tests have shown regressions.  Does this mean that Firefox v.63 (currently on Beta) is faster than Firefox Quantum release of last year?  I think the graphs here show that is true, but your mileage may vary.  It does help that we are testing the same tests (not changed) over time so we can really compare apples to apples.  There have been changes in the browser and updates to tools to support other features including some browser preferences that change.  We have found that we don’t necessarily measure real world experiences, but we get a good idea if we have made things significantly better or worse.

Some examples of how this might be different for you than what we measure in automation:

  • We test in an isolated environment (custom prefs, fresh profile, no network to use, no other apps)
  • Outdated pages that we load have most likely changed in the last year
  • What we measure as a startup time or a page loaded time might not reflect what a user perceives as accurate


3 Comments

Filed under general, testdev

Experiment: Adjusting SETA to run individual files instead of individual jobs

3.5 years ago we implemented and integrated SETA.  This has a net effect today of reducing our load between 60-70%.  SETA works on the premise of identifying specific test jobs that find real regressions and marking them as high priority.  While this logic is not perfect, it proves a great savings of test resources while not adding a large burden to our sheriffs.

There are a two things we could improve upon:

  1. a test job that finds a failure runs dozens if not hundreds of tests, even though the job failed for only a single test that found a failure.
  2. in jobs that are split to run in multiple chunks, it is likely that tests failing in chunk 1 could be run in chunk X in the future- therefore making this less reliable

I did an experiment in June (was PTO and busy on migrating a lot of tests in July/August) where I did some queries on the treeherder database to find the actual test cases that caused the failures instead of only the job names.  I came up with a list of 171 tests that we needed to run and these ran in 6 jobs in the tree using 147 minutes of CPU time.

This was a fun project and it gives some insight into what a future could look like.  The future I envision is picking high priority tests via SETA and using code coverage to find additional tests to run.  There are a few caveats which make this tough:

  1. Not all failures we find are related to a single test- we have shutdown leaks, hangs, CI and tooling/harness changes, etc.  This experiment only covers tests that we could specify in a manifest file (about 75% of the failures)
  2. My experiment didn’t load balance on all configs.  SETA does a great job of picking the fewest jobs possibly by knowing if a failure is windows specific we can run on windows and not schedule on linux/osx/android.  My experiment was to see if we could run tests, but right now we have no way to schedule a list of test files and specify which configs to run them on. Of course we can limit this to run “all these tests” on “this list of configs”.  Running 147 minutes of execution on 27 different configs doesn’t save us much, it might take more time than what we currently do.
  3. It was difficult to get the unique test failures.  I had to do a series of queries on the treeherder data, then parse it up, then adjust a lot of the SETA aggregation/reduction code- finally getting a list of tests- this would require a few days of work to sort out if we wanted to go this route and we would need to figure out what to do with the other 25% of failures.
  4. The only way to run is using per-test style used for test-verify (and the in-progress per-test code coverage).  This has a problem of changing the way we report tests in the treeherder UI- it is hard to know what we ran and didn’t run and to summarize between bugs for failures could be interesting- we need a better story for running tests and reporting them without caring about chunks and test harnesses (for example see my running tests by component experiment)
  5. Assuming this was implemented- this model would need to be tightly integrated into the sheriffing and developer workflow.  For developers, if you just want to run xpcshell tests, what does that mean for what you see on your try push?  For sheriffs, if there is a new failure, can we backfill it and find which commit caused the problem?  Can we easily retrigger the failed test?

I realized I did this work and never documented it.  I would be excited to see progress made towards running a more simplified set of tests, ideally reducing our current load by 75% or more while keeping our quality levels high.

Leave a comment

Filed under Uncategorized

running tests by bugzilla component instead of test suite

Over the years we have had great dreams of running our tests in many different ways.  There was a dream of ‘hyperchunking’ where we would run everything in hundreds of chunks finishing in just a couple of minutes for all the tests.  This idea is difficult for many reasons, so we shifted to ‘run-by-manifest’, while we sort of do this now for mochitest, we don’t for web-platform-tests, reftest, or xpcshell.  Both of these models require work on how we schedule and report data which isn’t too hard to solve, but does require a lot of additional work and supporting 2 models in parallel for some time.

In recent times, there has been an ongoing conversation about ‘run-by-component’.  Let me explain.  We have all files in tree mapped to bugzilla components.  In fact almost all manifests have a clean list of tests that map to the same component.  Why not schedule, run, and report our tests on the same bugzilla component?

I got excited near the end of the Austin work week as I started working on this to see what would happen.

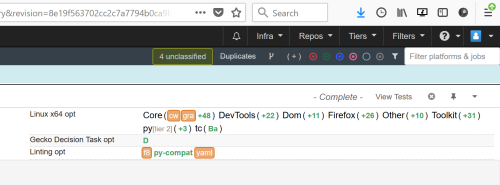
rbc

This is hand crafted to show top level productions, and when we expand those products you can see all the components:

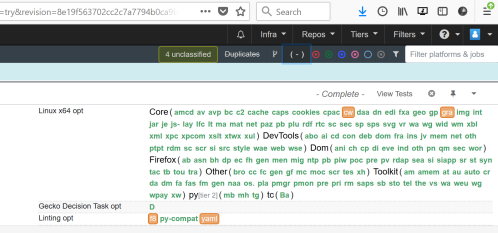
rbc_expanded

I just used the first 3 letters of each component until there was a conflict, then I hand edited exceptions.

What is great here is we can easy schedule networking only tests:

rbc_scheduling

and what you would see is:

rbc_networking

^ keep in mind in this example I am using the same push, but just filtering- but I did test on a smaller scale for a bit with just Core-networking until I got it working.

What would we use this for:

  1. collecting code coverage on components instead of random chunks which will give us the ability to recommend tests to run with more accuracy than we have now
  2. tools like SETA will be more deterministic
  3. developers can filter in treeherder on their specific components and see how green they are, etc.
  4. easier backfilling of intermittents for sheriffs as tests are not moving around between chunks every time we add/remove a test

While I am excited about the 4 reasons above, this is far from being production ready.  There are a few things we would need to solve:

  1. My current patch takes a list of manifests associated with bugzilla components are runs all manifests related to that component- we would need to sanitize all manifests to only have tests related to one component (or solve this differently)
  2. My current patch iterates through all possible test types- this is grossly inefficient, but the best I could do with mozharness- I suspect a slight bit of work and I could have reftest/xpcshell working, likewise web-platform tests.  Ideally we would run all tests from a source checkout and use |./mach test <component>| and it would find what needs to run
  3. What do we do when we need to chunk certain components?  Right now I hack on taskcluster to duplicate a ‘component’ test for each component in a .json file; we also cannot specify specific platform specific features and lose a lot of the functionality that we gain with taskcluster;  I assume some simple thought and a feature or two would allow for us to retain all the features of taskcluster with the simplicity of component based scheduling
  4. We would need a concrete method for defining the list of components (#2 solves this for the harnesses).  Currently I add raw .json into the taskcluster decision task since it wouldn’t find the file I had checked into the tree when I pushed to try.  In addition, finding the right code names and mappings would ideally be automatic, but might need to be a manual process.
  5. when we run tests in parallel, they will have to be different ‘platforms’ such as linux64-qr, linux64-noe10s.  This is much easier in the land of taskcluster, but a shift from how we currently do things.

This is something I wanted to bring visibility to- many see this as the next stage of how we test at Mozilla, I am glad for tools like taskcluster, mozharness, and common mozbase libraries (especially manifestparser) which have made this a simple hack.  There is still a lot to learn here, we do see a lot of value going here, but are looking for value and not for dangers- what problems do you see with this approach?

Leave a comment

Filed under testdev

Measuring the noise in Performance tests

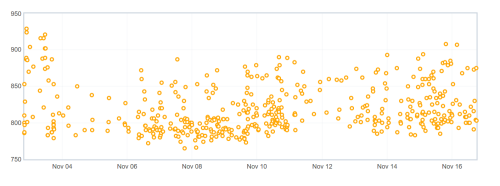
Often I hear about our talos results, why are they so noisy?  What is noise in this context- by noise we are referring to a larger stddev in the results we track, here would be an example:

noise_example

With the large spread of values posted regularly for this series, it is hard to track improvements or regressions unless they are larger or very obvious.

Knowing the definition of noise, there are a few questions that we often need to answer:

  • Developers working on new tests- what is the level of noise, how to reduce it, what is acceptable
  • Over time noise changes- this causes false alerts, often not related to to code changes or easily discovered via infra changes
  • New hardware we are considering- is this hardware going to post reliable data for us.

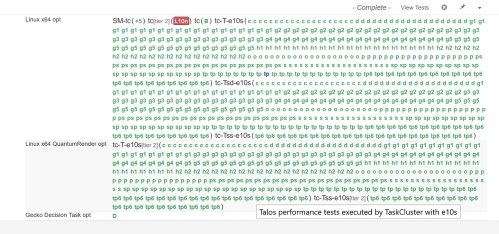
What I care about is the last point, we are working on replacing the hardware we run performance tests on from old 7 year old machines to new machines!  Typically when running tests on a new configuration, we want to make sure it is reliably producing results.  For our system, we look for all green:

all_green

This is really promising- if we could have all our tests this “green”, developers would be happy.  The catch here is these are performance tests, are the results we collect and post to graphs useful?  Another way to ask this is are the results noisy?

To answer this is hard, first we have to know how noisy things are prior to the test.  As mentioned 2 weeks ago, Talos collects 624 metrics that we track for every push.  That would be a lot of graph and calculating.  One method to do this is push to try with a single build and collect many data points for each test.  You can see that in the image showing the all green results.

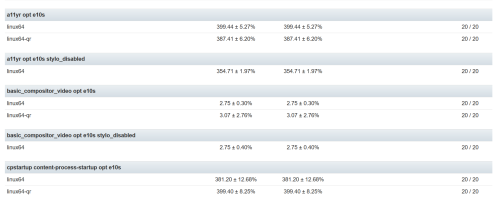
One method to see the noise, is to look at compare view.  This is the view that we use when comparing one push to another push when we have multiple data points.  This typically highlights the changes that are easy to detect with our t-test for alert generation.  If we look at the above referenced push and compare it to itself, we have:

self_compare


Here you can see for a11y, linux64 has +- 5.27 stddev.  You can see some metrics are higher and others are lower.  What if we add up all the stddev numbers that exist, what would we have?  In fact if we treat this as a sum of the squares to calculate the variance, we can generate a number, in this case 64.48!  That is the noise for that specific run.

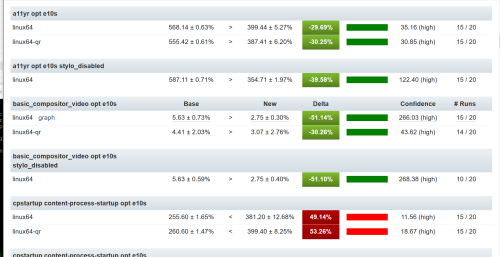
Now if we are bringing up a new hardware platform, we can collect a series of data points on the old hardware and repeat this on the new hardware, now we can compare data between the two:

hardware_compare

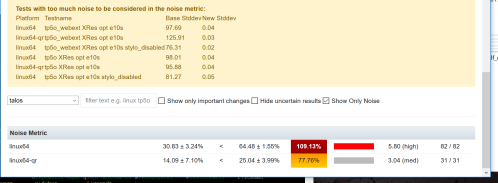
What is interesting here is we can see side by side the differences in noise as well as the improvements and regressions.  What about the variance?  I wanted to track that and did, but realized I needed to track the variance by platform, as each platform could be different- In bug 1416347, I set out to add a Noise Metric to the compare view.  This is on treeherder staging, probably next week in production.  Here is what you will see:

noise_view

Here we see that the old hardware has a noise of 30.83 and the new hardware a noise of 64.48.  While there are a lot of small details to iron out, while we work on getting new hardware for linux64, windows7, and windows10, we now have a simpler method for measuring the stability of our data.


2 Comments

Filed under testdev

Keeping an eye on Performance alerts

Over the last 6 months there has been a deep focus on performance in order to release Firefox 57. Hundreds of developers sought out performance improvements and after thousands of small adjustments we see massive improvements.

Last week I introduced Ionut who has come in as a Performance Sheriff.  What do we do on a regular basis when it comes to monitoring performance.  In the past I focused on Talos and how many bugs per release we found, fixed, and closed.  While that is fun and interesting, we have expanded the scope of sheriffing.

Currently we have many frameworks:

  • Talos (old fashioned perf testing, in-tree, per commit, all desktop platforms- startup, benchmarks, pageload)
  • build_metrics (compile time, installer size, sccache hit rate, num_constructors, etc.)
  • AWSY (are we slim yet, now in-tree, per commit, measuring memory during heavy pageload activity)
  • Autophone (android fennec startup + talos tests, running on 4 different phones, per commit)
  • Platform Microbenchmarks (developer written GTEST (cpp code), mostly graphics and stylo specific)

We continue to refine benchmarks and tests on each of these frameworks to ensure we are running on relevant configurations, measuring the right things, and not duplicating data unnecessarily.

Looking at the list of frameworks, we collect 1127 unique data points and alert on them with included bugs for anything sustained and valid.  While the number of unique metrics can change, here are the current number of metrics we track:

Framework Total Metrics
Talos 624
Autophone 19
Build Metrics 172
AWSY 83
Platform Microbenchmarks 229
1127

While we generate these metrics for every commit (or every few commits for load reasons), what happens is we detect a regression and generate an alert.  In fact we have a sizable number of alerts in the last 6 weeks:

Framework Total Alerts
Talos 429
Autophone 77
Build Metrics 264
AWSY 85
Platform Microbenchmarks 227
1082

Alerts are not really what we file bugs on, instead we have an alert summary when can (and typically) does contain a set of alerts.  Here is the total number of alert summaries (i.e. what a sheriff will look at):

Framework Total Summaries
Talos 172
Autophone 54
Build Metrics 79
AWSY 29
Platform Microbenchmarks 136
470

These alert summaries are then mapped into bugs (or downstream alerts to where the alerts started).  Here is a breakdown of the bugs we have:

Framework Total Bugs
Talos 41
Autophone 3
Build Metrics 17
AWSY 6
Platform Microbenchmarks 6
73

This indicates there are 73 bugs associated with Performance Summaries . What is deceptive here is many of those bugs are ‘improvements’ and not ‘regressions’.  If you figured it out, we do associate improvements with bugs and try to comment in the bugs to let you know of the impact your code has on a [set of] metric[s].

Framework Total Bugs
Talos 23
Autophone 3
Build Metrics 14
AWSY 4
Platform Microbenchmarks 3
47

This is a much smaller number of bugs- now there are a few quirks here-

  • some regressions show up across multiple frameworks (reduces to 43 total)
  • some bugs that are ‘downstream’ are marked against the root cause instead of just being downstream.  Often this happens when we are sheriffing bugs and a downstream alert shows up a couple days later.

Over the last few releases here are the tracking bugs:

Note that Firefox 58 has 28 bugs associated with it, but we have 43 bugs from the above query.  Some of those bugs from the above query are related to Firefox 57, and some are starred against a duplicate bug or a root cause bug instead of the regression bug.

I hope you find this data useful and informative towards understanding what goes on with all the performance data.

Leave a comment

Filed under testdev

Stockwell: flowchart for triage

I gave an update 2 weeks ago on the current state of Stockwell (intermittent failures).  I mentioned additional posts were coming and this is a second post in the series.

First off the tree sheriffs who maintain merges between branches, tree closures, backouts, hot fixes, and a many other actions that keep us releasing code do one important task, and that is star failures to a corresponding bug.

Sheriff

These annotations are saved in Treeherder and Orange Factor.  Inside of Orange Factor, we have a robot that comments on bugs– this has been changing a bit more frequently this year to help meet our new triage needs.

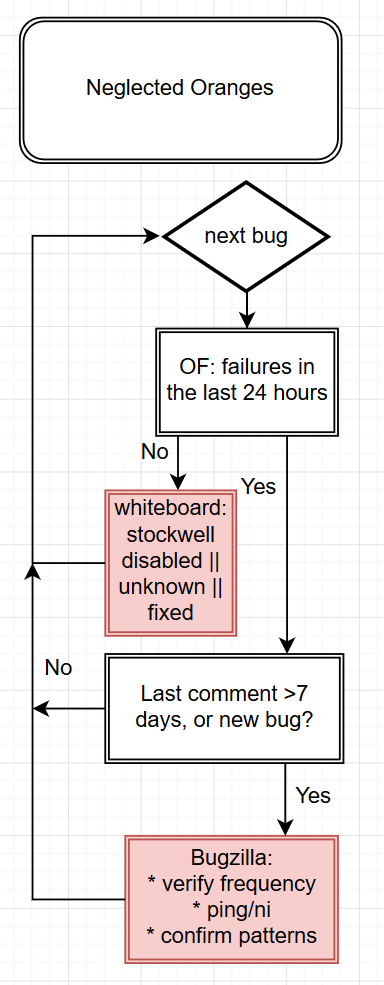
Once we get bugs annotated, now we work on triaging them.  Our primarily tool is Neglected Oranges which gives us a view of all failures that meet our threshold and don’t have a human comment in the last 7 days.  Here is the next stage of the process:

Triage

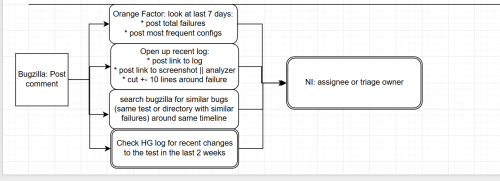
As you can see this is very simple, and it should be simple.  The ideal state is adding more information to the bug which helps make it easier for the person we NI? to prioritize the bug and make a decision:

Comment

While there is a lot more we can do, and much more that we have done, this seems to be the most effective use when looking across 1000+ bugs that we have triaged so far this year.

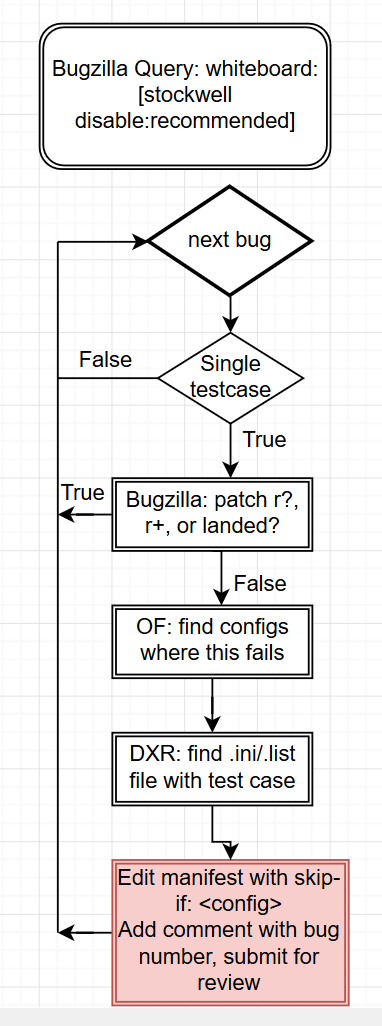
In some cases a bug fails very frequently and there are no development resources to spend fixing the bug- these will sometimes cross our 200 failures in 30 days policy and will get a [stockwell disabled-recommended] whiteboard tag, we monitor this and work to disable bugs on a regular basis:

Disable

This isn’t as cut and dry as disable every bug, but we do disable as quickly as possible and push hard on the bugs that are not as trivial to disable.

There are many new people working on Intermittent Triage and having a clear understanding of what they are doing will help you know how a random bug ended up with a ni? to you!

Leave a comment

Filed under intermittents, testdev

A formal introduction to Ionut Goldan – Mozilla’s new Performance Sheriff and Tool hacker

About 8 months ago we started looking for a full time performance sheriff to help out with our growing number of alerts and needs for keeping the Talos toolchain relevant.

We got really lucky and ended up finding Ionut (:igoldan on irc, #perf).  Over the last 6 months, Ionut has done a fabulous job of learning how to understand Talos alerts, graphs, scheduling, and narrowing down root causes.  In fact, he has not only been able to easily handle all of the Talos alerts, Ionut has picked up alerts from Autophone (Android devices), Build Metrics (build times, installer sizes, etc.), AWSY (memory metrics), and Platform Microbenchmarks (tests run inside of gtest written by a few developers on the graphics and stylo teams).

While I could probably write a list of Ionut’s accomplishments and some tricky bugs he has sorted out, I figured your enjoyment of reading this blog is better spend on getting to know Ionut better, so I did a Q&A with him so we can all learn much more about Ionut.

Tell us about where you live?

I live in Iasi. It is a gorgeous and colorful town, somewhere in the North-East of Romania.  It is full of great places and enchanting sunsets. I love how a casual walk
leads me to new, beautiful and peaceful neighborhoods.

I have many things I very much appreciate about this town:
the people here, its continuous growth, its historical resonance, the fact that its streets once echoed the steps of the most important cultural figures of our country. It also resembles ancient Rome, as it is also built on 7 hills.

It’s pretty hard not to act like a poet around here.

What inspired you to be a computer programmer?

I wouldn’t say I was inspired to be a programmer.

During my last years in high school, I occasionally consulted with my close ones. Each time we concluded that IT is just the best domain to specialize in: it will improve continuously, there will be jobs available; things that are evident nowadays.

I found much inspiration in this domain after the first year in college, when I noticed the huge advances and how they’re conducted.  I understood we’re living in a whole new era. Digital transformation is now the coined term for what’s going on.

Any interesting projects you have done in the past (school/work/fun)?

I had the great opportunity to work with brilliant teams on a full advertising platform, from almost scratch.

It got almost everything: it was distributed, highly scalable, completely written in
Python 3.X, the frontend adopted material design, NoSQL database in conjunction with SQL ones… It used some really cutting-edge libraries and it was a fantastic feeling.

Now it’s Firefox. The sound name speaks for itself and there are just so many cool things I can do here.

What hobbies do you have?

I like reading a lot. History and software technology are my favourite subjects.
I enjoy cooking, when I have the time. My favourite dish definitely is the Hungarian goulash.

Also, I enjoy listening to classical music.

If you could solve any massive problem, what would you solve?

Greed. Laziness. Selfishness. Pride.

We can resolve all problems we can possibly encounter by leveraging technology.

Keeping non-values like those mentioned above would ruin every possible achievement.

Where do you see yourself in 10 years?

In a peaceful home, being a happy and caring father, spending time and energy with
my loved ones. Always trying to be the best example for them.  I envision becoming a top notch professional programmer, leading highly performant teams on
sound projects. Always familiar with cutting-edge tech and looking to fit it in our tool set.

Constantly inspiring values among my colleagues.

Do you have any advice or lessons learned for new students studying computer science?

Be passionate about IT technologies. Always be curious and willing to learn about new things. There are tons and tons of very good videos, articles, blogs, newsletters, books, docs…Look them out. Make use of them. Follow their guidance and advice.

Continuous learning is something very specific for IT. By persevering, this will become your second nature.

Treat every project as a fantastic opportunity to apply related knowledge you’ve acquired.  You need tons of coding to properly solidify all that theory, to really understand why you need to stick to the Open/Closed principle and all other nitty-gritty little things like that.

I have really enjoyed getting to know Ionut and working with him.  If you see him on IRC please ping him and say hi 🙂


Leave a comment

Filed under Community